The BJP, its opposition and party system fluidity
K.K. KAILASH
IN the now ‘ancient’, highly popular arcade game called Pac-Man, a player advances to higher levels by navigating Pac-Man through a maze. Players get points for collecting dots, fruits and eating blue ghosts while at the same time steering clear of four multi-coloured monsters or ghosts. The story of the rise and rise of the Bharatiya Janata Party (BJP) under Amit Shah and Narendra Modi, is in many ways comparable to the Pac-Man game.
After the 2014 general elections, like Pac-Man, the BJP picked one state after another, expanding its acceptability as well as its territorial reach. From five states before the 2014 general elections, the BJP now controls 16 states. Today, after the 2019 elections, the BJP is currently playing at the highest level, and it now primarily has to defend its territory and maintain its level of acceptance.
Like Pac-Man’s four ‘monsters’ or ‘ghosts’, the challenge for the BJP also comes from four types of opposition. These include the Congress, state-based parties, an alliance of the Congress and state-based parties, and finally an alliance amongst state-based parties themselves (Table 1). In the last five years, these four oppositions challenged the BJP and even managed to bring it down on a couple of occasions as in Bihar (2015), Karnataka (2018), Rajasthan (2018), Madhya Pradesh (2018), and Chhattisgarh (2018). However, looking at the 2019 results, it now appears with the advantage of hindsight that the BJP learned from these hits and was prepared to take on the different types of opposition.
|
TABLE 1 The Four Challengers |
|||
|
Congress |
Alliance of Congress & state-based parties |
State- based parties |
Alliance of state-based parties |
|
Gujarat |
Jharkhand |
Telangana |
Uttar Pradesh |
|
Madhya Pradesh |
Bihar |
Andhra Pradesh |
|
|
Rajasthan |
Tamil Nadu |
West Bengal |
|
|
Chhattisgarh |
Karnataka |
Odisha |
|
|
Himachal Pradesh |
Maharashtra |
||
|
Uttarakhand |
Kerala |
||
In this paper, I attempt to answer why the opposition succeeded in some states and the reason it failed in others. A couple of caveats are, however, in order. First, I understand success and failure in relative and not absolute terms. A better position in terms of seats in 2019 compared to 2014 in a state is counted as a success. Second, I focus only on the states with more than 10 Lok Sabha representatives. This is because size appears to influence both party strategy as well as the nature of the political game. For instance, a comparison of the Congress campaign in the elections to the legislative assemblies in the north-eastern states, and other states like Rajasthan and Madhya Pradesh, between 2014 and 2018, shows that parties are concerned about the value of time and resources spent. Polity-wide parties do not give the same attention to small states as compared to the big states. At the same time, previous trends show that political parties in small states tend to swing towards the dominant party at the Centre.
Third, I exclude the first type of opposition to the BJP, i.e. the challenge from the Congress. The BJP versus Congress competition has received substantial attention, and the results show that the BJP does better in a face-off with the Congress.1 This then leaves us with three types of opposition to the BJP, namely an alliance of the Congress and state-based parties, an alliance of state-based parties, and finally state-based parties. This exclusion allows us to focus more closely on state-based parties since logically, after a ‘Congress mukt Bharat’, the BJP is likely to train its guns on regional and state-based parties.
M
y primary explanatory variable revolves around the mobilization of non-partisans. I include two categories of voters under non-partisans. First, those voters who are traditionally not supporters of any political party. Second, those who traditionally voted for ‘other’ parties or bit players (all parties besides the dominant or established parties). The movement of these two categories of voters tells us a lot about the mobilization efforts of political parties. Previous studies show that parties are likely to concentrate on people who were not previously involved in politics.2 Going by this logic, it follows that those who are not supporters of any political party are likely to receive special attention during the mobilization campaign.
F
urthermore, parties are unlikely to focus on partisans, especially those from established parties, but are likely to invest efforts in mobilising supporters of bit players. Traditional supporters of rival established parties, which have been in government or close to the government, will either have access to power or know-how to gain access. However, supporters of bit players are likely to be swayed by mobilizational persuasion and, therefore, vulnerable to shift.The quantum of non-partisan votes received by a party will tell us about the mobilization strategy and the effort made by a particular party. If the opposition – alliance of Congress and state-based parties, state-based parties or alliance between state-based parties – can attract a greater share of the non-partisan votes, it increases its chances of winning a higher percentage of the seats. It follows that if the non-partisan votes move towards the BJP, the latter is likely to be more successful.
In conjunction with the mobilization of the non-partisan voter variable, I also look at voter satisfaction with the functioning of the central government and the popularity of the BJP’s candidate for the post of prime minister. I am aware that explaining either the loss or re-election of both incumbent legislators and governments is a complicated exercise, and there is no consensus on the explanatory variables. For instance, after controlling many factors used to explain vote choice, Verma found that satisfaction of the voter with the incumbent’s performance at multiple levels, including the Centre, state as well as the constituency, is the most significant predictor of vote choice.3 The choice of voter satisfaction with the central government and leader popularity is influenced by the central question as to why the opposition failed in some states and succeeded in others. This focus on the Centre and the choice of prime minister helps control for variation at other levels.
F
inally, I use the concept of ‘closed’ and ‘open’ party systems4 to tie all this together. In Mair’s framework, in closed party systems, party competition is reasonably predictable with little or no change in governing alternatives over time. Whereas in open party systems, party competition is not only unpredictable but is also characterized by varying patterns of alternation and changing composition of government alternatives. Though Mair used this differentiation in the context of competition for the executive, it is useful in the context of electoral competition as well.5In closed, compared to open party systems, I believe there is a higher degree of party attachment and voters are unlikely to move away from the established to ‘new’ parties. It follows that voters are likely to be more partisan in closed as compared to open party systems. I expect that party attachment is likely to determine positions on both these questions in closed party systems. In open party systems, one can expect a greater deal of fluidity in choices since party attachments are relatively weak.
In perfectly closed party systems, there will be no space for new entrants and all votes would be apportioned between the existing players. On the contrary, in perfectly open party systems, there will no structure since there is no fixed or guaranteed system of relationships between political parties. Both perfect closed and open party systems are theoretical possibilities. Real party systems only approximate the theoretical possibility.
I
n closed party systems, it follows that we should expect unaligned voters to support known/established/dominant parties in the state party system rather than an ‘outsider’ party. Similarly, supporters of other parties should also prefer the dominant parties in case they decide to shift loyalties, rather than ‘new’ players. In more open party systems, non-partisan voters are unlikely to restrict themselves to the established parties. ‘New’ and ‘outsider’ parties are those parties which are bit players and have not been part of the governing coalition or have been part of the governing coalition only because of space provided by the dominant parties. Furthermore, in closed party systems, voters are unlikely to be swayed by choices and offers made by ‘outsider’ parties even if they were key players at other levels.I use the BJP as a reference point since we are looking at states where the BJP made inroads despite the opposition. If the BJP gets a substantial chunk of these votes in states where it is not an established party, it may be concluded that the BJP is making inroads into an otherwise closed party system.
I
n the 2019 elections, the BJP not only increased its seat and vote share but also expanded its geographical footprint. In 20 states and union territories, the party received more than 40% of the valid votes in the seats it contested. These included big states like Rajasthan, Madhya Pradesh and Karnataka. For a better perspective, we should compare these results with that of the Congress (Table 2). While the Congress got less than 10% of the valid votes in big states like Uttar Pradesh, Bihar and West Bengal, the BJP performed similarly in the smaller states like Meghalaya, Manipur and Nagaland.
|
TABLE 2 Comparing Valid Votes |
||||
|
Votes (%) |
BJP 2014 |
BJP 2019 |
INC 2014 |
INC 2019 |
|
>60 |
1 |
3 |
0 |
0 |
|
50-59 |
6 |
10 |
0 |
1 |
|
40-49 |
9 |
7 |
9 |
8 |
|
30-39 |
3 |
3 |
10 |
8 |
|
20-29 |
3 |
2 |
6 |
8 |
|
10-19 |
3 |
2 |
5 |
4 |
|
<10 |
7 |
8 |
5 |
7 |
|
Source : 2014 General Elections: eci.gov.in; 2019 General Elections: Lokniti Data Unit. Note: Includes all states (29) and union territories (7). |
||||
Compared to 2014, the BJP faced more pre-electoral coalitions. The picture does not change much when we examine the performance of the BJP vis-à-vis the three types of opposition. In Uttar Pradesh (80), the BJP faced an alliance of state-based parties. Two state-based parties, the Bahujan Samaj Party (BSP) and the Samajwadi Party (SP), which had been at loggerheads for more than two decades, decided to come together. They also included Ajit Singh’s Rashtriya Lok Dal (RLD), and together they formed what was called the Mahagathbandhan. The alliance hoped that vote pooling and caste arithmetic would bring them better results compared to 2014 when they had contested separately. The results were almost the same, and the BJP increased its vote share compared to the last election (Table 3).
|
TABLE 3 The BJP and its Opposition |
||||||||
|
Alliance of Congress & state-based parties |
2014 seats (vote %) |
2019 seats (vote %) |
State-based parties |
2014 seats (vote %) |
2019 seats (vote %) |
Alliance of state-based |
2014 seats (vote %) parties |
2019 seats (vote %) |
|
Jharkhand |
12 (40.71) |
11 (50.96) |
Telangana |
3 (8.52) |
4 (19.45) |
Uttar Pradesh |
71 (42.63) |
62 (49.56) |
|
Bihar |
22 (29.86) |
17 (23.58) |
Andhra Pradesh |
3 (8.52) |
0 (0.96) |
|||
|
Tamil Nadu |
1 (5.56) |
0 (3.66) |
West Bengal |
2 (17.02) |
18 (40.25) |
|||
|
Karnataka |
17 (43.37) |
25 (51.38) |
Odisha |
1 (21.88) |
8 (38.37) |
|||
|
Maharashtra |
23 (27.56) |
23 (27.59) |
||||||
|
Kerala |
0 (10.45) |
0 (12.93) |
||||||
S
imilarly, the BJP was successful in states like Jharkhand (14), Bihar (40) Karnataka (28) and Maharashtra (48) despite the alliance of the Congress with state-based parties. The party obtained more seats in these states, except Maharashtra, compared to 2014. The BJP in 2019 made significant inroads in states where it was challenged by state-based parties. The party substantially increased its seat and vote share in the states of West Bengal (42), Odisha (21) and Telangana (17). This advance of the BJP in state-based party territory is probably the stand-out point of the 2019 election. The BJP’s performance, however, remains unchanged in the states of Andhra Pradesh, Kerala and Tamil Nadu. Unlike in other states, the party was not able to improve its position, drawing a blank in all three.In Table 4, I compare the votes that went to the BJP and other parties in the states we are analysing. The three states where the BJP failed to obtain a single seat – Kerala, Tamil Nadu and Andhra Pradesh – are closed party systems. The BJP was never a player in these states and was not allowed entry despite its growing popularity, acceptance and its claims of programmatic achievements. Voters in these states preferred to rely on the established parties.
|
TABLE 4 Comparing Support from Others and Unaligned Voters (in percentage) |
|||
|
State |
Established parties |
BJP |
Others |
|
Andhra Pradesh |
YSRCP, TDP |
0.66 |
65.56 (YSRCP) |
|
Tamil Nadu |
DMK, AIADMK |
1.94 |
34.24 (DMK) |
|
Kerala |
LDF, UDF |
11.3 |
57.19 (UDF) |
|
Bihar |
JD(U), RJD, BJP |
21.98 |
27.10 (JD(U)) |
|
Maharashtra |
SHS, BJP, NCP, INC |
22.16 |
41.87 (Others) |
|
Telangana |
TRS, INC |
34.61 |
37.5 (TRS) |
|
Odisha |
BJD, INC |
37.11 |
38.14 (BJD) |
|
Karnataka |
BJP, INC, JD(S) |
45.38 |
26.92 (JD (S)) |
|
Jharkhand |
BJP, INC, JMM, RJD |
47.69 |
33.84 (RJD) |
|
Uttar Pradesh |
BJP, SP, BSP |
49.07 |
37.82 (Mahagatbandan) |
|
West Bengal |
AITC, INC |
56.3 |
32.77 (AITC) |
|
Source : NES 2019, Lokniti CSDS Data Unit. |
|||
I
n Telangana and Odisha, despite the BJP traditionally being a bit player, it made inroads. Here the BJP displaced the Congress which has been the dominant actor alongside the state-based party. In both these states, the BJP garnered almost the same percentage of votes as the dominant state-based parties from the unaligned voters as well as those who traditionally voted for other parties. Traditionally these votes would have gone to the Congress. In West Bengal, the BJP did one step better; it not only displaced the Congress but also received greater support than the Trinamool Congress (AITC) from these two categories of voters.In Uttar Pradesh, notwithstanding the Mahagathbandhan, the BJP was the more attractive party for most voters including the unattached and those who traditionally voted for other parties, garnering nearly 50% of their votes. Similarly, in Jharkhand, despite the alliance, the BJP was the preferred choice among the voters. In Maharashtra, despite the Congress-NCP (Nationalist Congress Party) alliance, and both being established parties, the unaligned as well the traditional other party voters did not prefer them. It appears that Maharashtra is ripe for churning, with voters looking for an alternative.
A similar picture emerges when we look at two other variables, including satisfaction with the central government and the popularity of Narendra Modi. Voter responses here will give us clues to the fluidity in the system. In states where the satisfaction and popularity levels are high, despite the BJP being a bit or a non-player, we can expect the BJP to be successful. Similarly, when satisfaction and popularity levels are high, it is unlikely that opposition alliances will make a difference.
I
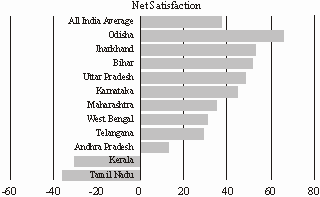
n a Lok Sabha election, voter satisfaction with the incumbent central government increases the chances of its re-election. The BJP’s chances of increasing its footprint and acceptability increase with higher satisfaction levels. Here I use a net-satisfaction index (Satisfaction minus Dissatisfaction) to gauge the popularity levels of the incumbent government. The index has a range from -100 to +100, with the negative sign indicating dissatisfaction and the positive sign indicating satisfaction. Higher the net-satisfaction, greater the chances of voters preferring the BJP over other parties or their alliances.
W
hile the average net-satisfaction level was around 38%, there were many states which had even higher levels (Table 5). In Bihar, Uttar Pradesh, Karnataka and Jharkhand, where the alliance of Congress and state-based parties challenged the BJP, the net satisfaction levels were way above the national average, leaving little space for the alliance to make a mark. Likewise, in Maharashtra, the net-satisfaction level was near the average.In West Bengal and Odisha, where the BJP faced single-state parties, we again find that voters were generally satisfied with the central government. In the case of Odisha, voters were highly satisfied with both the central government and the state government (55%). While the Biju Janata Dal (BJD) was voted back at the state level, the BJP made substantial gains in the Lok Sabha. In Telangana too, the voters were highly satisfied with the state government (54%) but preferred to give the BJP a chance at the Centre. In the case of these three states, the Congress which was the alternative to the state-based party is being edged out, and the BJP appears to have a foot in the door.
Kerala, Tamil Nadu and Andhra Pradesh show low levels of fluidity. Voters in both Kerala and Tamil Nadu have taken partisan positions on the question of satisfaction with the central government. Notwithstanding the intense campaign around governmental performance and policy deliverance, voters in these states preferred known parties.
T
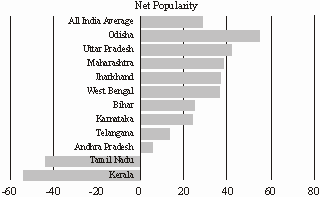
he BJP ran a presidential type of campaign, not only highlighting the leadership and performance of Modi but also implicitly comparing him with the Congress President Rahul Gandhi as part of the campaign rhetoric. For making sense of popularity, a simple Modi popularity index was created by subtracting the popularity of Modi from that of Rahul Gandhi. A negative score indicates that Rahul Gandhi was more popular compared to Modi. In states where the net popularity is high, we should expect the BJP to make gains.Modi was generally more acceptable across the country, and our selected states followed the same pattern as with satisfaction with the central government. In Uttar Pradesh, Jharkhand, Maharashtra, West Bengal and Odisha, the net popularity of Modi was much higher than the national average. In our perfect closed party systems in Kerala and Tamil Nadu, Rahul Gandhi was way over Modi. Modi was slightly more popular in the Telegu speaking states of Andhra Pradesh and Telangana, but much below the national average.
T
he BJP was largely successful in tackling the challenges it faced from the three types of opposition, namely, the Congress-led alliance of state-based parties, state-based parties and an alliance amongst state-based parties. The opposition alliances, whether it was the Congress-led alliance in Maharashtra, Jharkhand, Karnataka and Bihar, or the Mahagathbandhan in Uttar Pradesh, failed to attract the non-partisan voter. The BJP in all these states was more successful than the opposition in persuading the non-partisan to vote for the BJP. Additionally, we also saw that satisfaction with the central government and the popularity of Narendra Modi over Rahul Gandhi was way higher than the national average in most of these states. This necessarily meant that the mobilization and campaign strategy of the BJP was far more effective than that of the opposition. This means that alliances based on caste arithmetic and vote pooling will not hold in the wake of a sustained and systematic campaign.
|
CHART 1 Net Satisfaction with the Central Government |
|
|
|
|
|
Source : NES 2019, Lokniti-CSDS Data Unit. |
|
While the BJP succeeded in opening up three closed party systems, including West Bengal, Odisha and Telangana, it failed in Kerala, Tamil Nadu and Andhra Pradesh. The BJP was traditionally a bit player in West Bengal, Odisha and Telangana. The main competition in these states was between the Congress and a state-based party. However, a close look at the voting patterns indicates that these ‘closed’ systems are now fluid. A study of political rallies shows that 40% of Narendra Modi’s rallies were in the three states of Uttar Pradesh, West Bengal and Odisha.6 This shows that the party invested much energy in West Bengal and Odisha. It is then not surprising that the Congress does not appear to be the preferred choice of non-partisan voters, who instead prefer the ‘new’ party, the BJP. This is in sharp contrast with Kerala, Tamil Nadu and Andhra Pradesh, where the non-partisan voter rejected the new entrant. Furthermore, unlike in other states, the voters in Kerala and Tamil Nadu were neither satisfied with the performance of the central government, nor were they swayed by the popularity of Narendra Modi.
To conclude, looking back at the last five years and the 2019 campaign, it is likely that the BJP’s electoral machine will constantly be at work to both maintain its level of acceptance and also check the various oppositions. At the same time, the party is likely to work more on tackling state-based parties given that it now has the upper hand vis-à-vis the Congress. Finally, the party is expected to invest greater energy in opening up the closed party systems of Kerala, Tamil Nadu and Andhra Pradesh.
* I sincerely thank Jyoti Mishra and Vibha Attri for assistance in research. The survey data used here was made available by the CSDS-Lokniti Data Unit. Neither the Lokniti network nor the Data Unit bear any responsibility for the analysis and interpretation presented here. I am responsible for any errors that remain.
Footnotes:
1. S. Palshikar, ‘The Defeat of the Congress’, Economic and Political Weekly 49(39), 2014, pp. 57-63.
2. O. Heath and A. Ziegfeld, ‘Electoral Volatility and Turnout: Party Entry and Exit in Indian Elections’, The Journal of Politics 80(2), 2018, pp. 570-584.
3. R. Verma, ‘What Determines Electoral Outcomes in India? Caste, Class, or Voters’ Satisfaction with Government Performance?’ Asian Survey 52(2), 2012, pp. 270-297.
4. Peter Mair, Party System Change: Approaches and Interpretations. Clarendon Press, Oxford, 1997.
5. K.K. Kailash, ‘The Last Posts: The BJP in "Non-BJP" States’, in Suhas Palshikar, Sanjay Kumar and Sanjay Lodha (eds.), Electoral Politics in India: The Resurgence of the Bharatiya Janata Party. Routledge, New Delhi, 2017, pp. 69-89.
6. S. Upadhyay, Elections 2019: Breaking Down Election Campaigns of PM Modi and Rahul Gandhi in Numbers, https://www.ndtv. com/india-news/elections-2019-breaking-down-election-campaigns-of-pm-modi-and-rahul-gandhi-in-numbers-2039438 (accessed 17 July 2019).