Technology: drugs and diagnostics in health
SAKTHIVEL SELVARAJ and AASHNA MEHTA
MEDICINES and diagnostics are essential components of the health system as they contribute to improving health and reducing the burden of disease. Recent gains in technological innovation and the resultant development of medicines and diagnostics has, however, not improved access for the most vulnerable populations in need of these products. India, popularly known as the pharmacy of the global South, continues to grapple with several barriers to such access resulting in people continuing to incur huge out of pocket expenditures.
Household out of pocket expenditure accounts for 69% of the total health expenditure in India.
1 A majority of such expenditure is for medicines alone. The central government spending on medicines in 2010-11, was about 13% of its total health expenditure. There were significant inter-state variations with Kerala spending the highest proportion of its health expenditure on medicines at 12.5% and Punjab the lowest at only 1% (see annexure 1). Low public spending is the reason for high out of pocket spending.On an average, an Indian spends INR 2,284 per episode (or 41.44% of the total treatment expenditure) on medicines during hospitalization in the public sector in rural areas and INR 2,222 (or 29.27% of the total treatment expenditure) in urban areas. In contrast, such spending in private hospitals in rural and urban areas, on average, was INR 5362 (or 24.68% of the total treatment expenditure) and INR 6201 (or 19.15% of the total treatment expenditure) in urban areas
2 respectively. Clearly, it is the rural population that seem to incur higher out of pocket expenses on medicines in public and private hospitals. Similarly, there are substantial inter-state variations in medicine expenditures as well. (see annexures 2 and 3).Selvaraj, Farooqui and Karan
3 noted that the proportion of the population incurring out of pocket spending for seeking treatment went up significantly from about 60% in 1992-94 to 80% in 2011-12 and approximately every out of pocket spending is associated with expenditure on medicines. In fact, during the same period, household spending on medicines increased by over 70%. In 2011-2012, medicines alone accounted for 67% of total out of pocket spending. In the same year, 38 million people were impoverished or pushed below the poverty line due to health costs.
A
reliable and efficient procurement system is vital for enhancing access. Essential medicines should be procured in sufficient quantities at lowest possible rates to secure maximum therapeutic value to maximum possible beneficiaries within the available resources. An efficient procurement system involves the preparation of an essential medicine list, quantity and quality assessment, procurement of medicines, supply chain management and timely payment to suppliers to avoid shortages and stock outs and undertaken with utmost transparency.States follow different modes of procurement and supply chain management with different outcomes. In 1994, a system of pooled procurement was pioneered in India by Tamil Nadu through the establishment of the autonomous Tamil Nadu Medical Services Corporation (TNMSC). The model consists of centralized procurement and decentralized distribution of medicines, free of charge at public health facilities. Medicines enlisted on the state’s list of essential medicines are sourced into health facilities through district warehouses with the help of passbooks indicating monetary entitlements available for each institution. All district warehouses are linked to the central computer at the head office under the drug distribution management system (DDMS) wherein allocation and receipt of medicines is computerized. Rajasthan replicated this model through the establishment of the Rajasthan Medical Services Corporation (RMSC) in 2011. Under both the models, a two-bid process is undertaken viz. technical and financial. Under both systems, some of the procurement budget is allocated directly to each facility to meet contingencies as and when they arise.
While some states, like the ones discussed above, have done well in terms of ensuring efficient procurement and supply chain management, other Indian states continue to struggle with the availability of medicines at the point of care. An assessment of the procurement systems across eight Indian states
4 observed that for a common basket of medicines, the mean availability on the day of the survey was the highest in Tamil Nadu (81%), followed by Rajasthan (79%) with the lowest in Jammu and Kashmir (38%) followed by Uttar Pradesh (57%). The mean availability in Haryana, Karnataka, Kerala and Punjab was 73, 72, 71 and 68% respectively. Further, it was noticed that across all states the availability was generally low at PHCs and only increases with the level of care. When medicines are unavailable in the public sector, people are left with no choice other than to rely on the private sector.
I
n 2016, the pharmaceutical market in India was worth INR 11,2410.80 crore. During that year, the top five highest selling therapeutic segments were anti-infectives (13.30%), cardiac (11.72%), gastrointestinal (10.64%), anti-diabetic (8.58%) and pain/analgesics (7.96%). In terms of sales volumes, 57,11,75,840 thousand standard units were sold in India. The top five highest selling segments in terms of sales volumes were gastro-intestinal (16.68%), respiratory (15.95%), vitamins/minerals/nutrients (13.69%), pain/analgesics (7.16%) and derma (7.14%) (see annexure 4 for a comprehensive table).
O
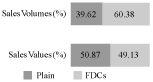
ver 60% of the market comprises fixed dose combinations (FDCs) in terms of sales volumes and 49% in terms of sales value (see figure 1). FDCs are often unnecessary and irrational and should be avoided unless providing added therapeutic value. The overwhelming prevalence of FDCs in the Indian market point towards inadequate regulations discouraging the irrational use of medicines.|
FIGURE 1 FDCs in the Indian Pharmaceutical Market |
|
|
|
Source : Authors computations based on data from IMS Health (now IQVIA). |
The highest selling brands in terms of sales values are Mixtard, an insulin brand accounting for 0.50% of the market in terms of sales value and 0.05% of the market in terms of sales volume and Glycomet-GP, another anti-diabetic accounting for 0.35% of the market in terms of sales value and 0.13% of the market in terms of sales volume. Interestingly, the third highest selling brand is Corex, a cough syrup. Six of the top 10 selling brands are anti-diabetics. This includes Novomix, Lantus, Galvus Met and Janumet (see Table 2). The second and third highest selling medicines are antibiotics-Amoxicillin trihydrate + clavulanic acid potassium salt and Cefixime. Other antibiotics in the list of the top 10 medicines are Cefriaxone Disodium, Cefpodoxime Proxetil and Azithromycin (see Table 1) indicating the widespread use of antibiotics , often prescribed or bought over the counter, to treat viral infections, thereby contributing to the increasing threat of antimicrobial resistance.
|
TABLE 1 Top 10 Highest Selling Formulations in the Indian Pharmaceutical Market in Terms of Sales Value, 2016 |
|||
|
Rank |
Formulation |
Value (%) |
Volume (%) |
|
1 |
Glimepiride + Metformin hydrochloride |
1.62 |
0.61 |
|
2 |
Amoxicillin trihydrate + Clavulanic acid potassium salt |
1.55 |
0.62 |
|
3 |
Cefixime |
0.86 |
0.46 |
|
4 |
Paracetamol |
0.85 |
2.00 |
|
5 |
Ceftriaxome disodium |
0.81 |
0.04 |
|
6 |
Insulin human base recombinant + Insulin human isophane recombinant |
0.79 |
0.08 |
|
7 |
Cefpodoxime proxetil |
0.76 |
0.35 |
|
8 |
Atorvastatin calcium salt |
0.76 |
0.23 |
|
9 |
Pantoprazole sodium salt |
0.73 |
0.22 |
|
10 |
Azithromycin |
0.64 |
0.21 |
|
Source : Authors computations based on data from IMS Health (now IQVIA) |
|||
|
TABLE 2 Top 10 Highest Selling Brands in the Indian Pharmaceutical Market in Terms of Sales Value, 2016 |
|||
|
Rank |
Brand |
Value (%) |
Volume (%) |
|
1 |
Mixtard |
0.50 |
0.05 |
|
2 |
Glycomet-GP |
0.35 |
0.13 |
|
3 |
Corex |
0.34 |
0.88 |
|
4 |
Monocef |
0.30 |
0.01 |
|
5 |
Novomix |
0.29 |
0.00 |
|
6 |
Augmentin |
0.28 |
0.08 |
|
7 |
Thyronorm |
0.28 |
0.56 |
|
8 |
Lantus |
0.28 |
0.00 |
|
9 |
Galvus met |
0.27 |
0.03 |
|
10 |
Janumet |
0.27 |
0.03 |
|
Source : Authors computations based on data from IMS Health (now IQVIA) |
|||
T
he import, manufacture, distribution and sale of medicines in India is regulated by central legislation under the Drugs and Cosmetics Act, 1940 (amended 2005).5 Pharmaceutical regulation in India involves several key regulators across different ministries under the Government of India (GoI) and is quite complex. Two of the key ministries that directly regulate medicines are the Ministry of Chemical and Fertilizers as well as the Ministry of Health and Family Welfare.
T
he Department of Pharmaceuticals (DoP) was established under the Ministry of Chemicals and Fertilizers (MoCF) in the year 2008 in order to develop the pharmaceutical sector, promote and coordinate research in pharmaceuticals, develop infrastructure and manpower for the pharmaceutical sector, promote public-private partnerships in pharmaceutical related areas, among others.6 The National Pharmaceutical Pricing Authority (NPPA) was established under the same ministry for monitoring and regulating prices and availability of medicines in the country.7 NPPA that comes under the purview of the DoP, and implements the National Pharmaceutical Pricing Policy (NPPP), discussed in the following section.The Central Drugs Standard Control Organization (CDSCO), headed by the Drugs Controller General of India (DCGI) under the Ministry of Health and Family Welfare (MoHFW), provides market authorization for medicines based on their safety, quality and efficacy and regulates the quality of imported medicines, providing approvals for clinical trials and coordinating the activities of State Drug Control Organizations.
8The manufacture, sale and distribution of medicines is regulated by state authorities and the four zonal offices of the CDSCO help ensure uniform enforcement.
9 However, it has been noted that there are varying procedures and standards imposed by authorities in different states leading to a situation where pharmaceutical producers tend to apply for licenses in other more compliant states when denied a license in their own state from where their product can be sold across the country.10 Schedule M under the Drugs and Cosmetics Act specifies guidelines for Good Manufacturing Practices (GMP) to ensure consistency in maintaining standards of quality. Unfortunately, the implementation of this schedule has been inadequate and several small-scale producers do not conform to the specified standards.11
S
everal countries employ policy interventions for regulating prices of medicines. The World Health Organization (WHO)12 also recommends the use of different forms of price regulation such as health technology assessment (HTA), external reference pricing, therapeutic reference pricing, regulation of mark-ups, tax exemptions/ reductions, and so on.
T
he current policy for regulating medicine prices in India is referred to as the National Pharmaceutical Pricing Policy (NPPP), 2012. The policy laid down three criteria for regulating medicine prices in the country. These criteria are (i) regulation of prices based on ‘essentiality of drugs’ meaning formulations listed under the national list of essential medicines (NLEM) notified by the Ministry of Health and Family Welfare; (ii) control of formulation prices only, i.e. prices of active pharmaceutical ingredients or bulk drugs remain unregulated; and (iii) Marketbased pricing.13 The policy was implemented through the Drug Price Control Order (DPCO), 2013 and ceiling prices of medicines under NLEM, 2011 were computed by the NPPA using the following market based formula:P(s) = (Sum of prices to retailer of all the brands and generic versions of the medicine with market share ³ 1% of the total market turnover on the basis of moving annual turnover of that medicine)/(total number of such brands and generic versions of the medicine)
Where, P(s) is the average price to retailer
Then retailer’s margin at the rate of 16% was added to this to obtain the ceiling price. An annual increase proportionate to the wholesale price index (WPI) in prices is allowed for medicines under the NLEM. An annual increase up to 10% is allowed for all medicines outside the NLEM.
An independent evaluation
14 of the policy observed that the drug price control order covers about 17% of the Indian pharmaceutical market in terms of sales value. This is because only prices of medicines with exact strengths and dosage as enlisted under the national list are under price control. Further, the study found that the policy would lead to little reductions in medicine prices owing to the marketbased formula.15The NLEM was revised in 2015. According to the latest NLEM, in 2016, only 17.67% of the market was under price regulation in terms of sales values and 19.07% of the market was under price regulation in terms of sales volumes. There is significant variation in terms of coverage across therapeutic segments (see annexure 5). The highest coverage was in the segment anti-parasitic (72.76% in terms of value and 84.40% in terms of volume) followed by anti-malarials (51.59% in terms of value and 40.03% in terms of volume). Other vital segments such as anti-diabetics, gastro-intestinal medicines and respiratory medicine had very low coverage.
T
he Indian Patent Act, 1970, abolishing product patents and recognizing process patents on products, provided the breakthrough for the development of the domestic pharmaceutical industry. This resulted in the local industry building the capacity for reverse engineering for developing and marketing copies of patented medicines at prices lower than the originators.16However, in 2005, the country transitioned to the product patent regime in order to comply with the Trade Related Aspects of Intellectual Property Rights (TRIPS) agreement. Since then, firms with a new invention are granted patents for a period of 20 years from the date of filling of the patent application thereby preventing the entry of low-cost generic versions of the patented medicines into the market.
I
t should be noted that the TRIPS agreement allows the signatory countries a certain flexibility in order to safeguard public interest. Countries can define the scope of patentability within their own patent laws. The Indian Patents Act makes good use of this provision by discouraging frivolous patenting. Gopakumer17 noted that the pharmaceutical industry is known for ‘evergreening’ or the practice of filing patents by modifying existing molecules in a way that makes it appear novel without altering the efficacy is an attempt to keep generic competition at bay for longer periods of time. When Novartis, a Swiss multi-national made such an attempt for its blockbuster medicine Imatinib, used for the treatment of Chronic Myeloid Leukaemia (CML) and marketed under the brand name Glivec, its patent application was rejected by the Government of India.The government’s decision was challenged in the Supreme Court which upheld the decision of the government. However, this is unfortunatelya rare instance, as high patentability standards are often not implemented in practice and several patents are granted on incremental innovations not meeting efficacy requirements.
18
C
ompulsory licensing (CL), which lets governments, in the interest of public health, authorize the production of a medicine by a company other than the originator/patent holder, is another flexibility allowed under TRIPS. However, according to Chaudhari et al.,19 the procedure for issuing a compulsory license in Indian law is overly complicated and allows patent holders to delay the process. The Indian government utilized this flexibility only once when it issued a compulsory license to the Indian generic manufacturer Natco for producing German pharmaceutical company Bayer AG’s cancer medicine Sorafenib Tosylate marketed as Nexavar, in March 2012 thereby considerably driving down the price of medicine.20Further, the TRIPS agreement allows procedural safeguards in the form of pre- and post-grant oppositions to prevent the grant of frivolous and legally invalid patents. However, studies point towards the underutilization of these provisions in the country due to reasons such as barriers in access to information, lack of awareness and capacity among generic companies.
21 In the absence of adequate financial risk protection, alongside the ineffective implementation of flexibilities allowed under TRIPS and incorporated under the Indian patent law, essential and life saving medicines remain out of the reach of a majority of Indians owing to high prices of patented medicines.
M
ahal and Karan22 noted that the utilization of diagnostic tests, particularly X-Ray, ECG and ultrasound, has been increasing since the year 1995-1996. Of the people hospitalized in India in 2004, 57.3% underwent X-Rays, ECGs and ultrasounds. For people seeking out-patient care, the percentage was 8.9%. Whereas the utilization rates in the last decade have been higher for the hospitalized urban, in comparison to rural patients, the utilization of diagnostic tests has risen faster for rural patients during the period between 1995-96 and 2004. This is possibly on account of the fact that the market for such tests is maturing in the rural areas. However, there is still a deficit and a greater scope of utilization.On an average, an Indian spends INR 857 per episode of hospitalization (or 15.55% of the total treatment expenditure) on diagnostic tests in the public sector in rural areas and INR 856 (or 11.28% of the total treatment expenditure) in urban areas. In case of hospitalization in the private sector, an average spend is INR 2063 (or 38.47% of the total treatment expenditure) in rural and INR 2759 (or 11.28% of the total treatment expenditure) in urban areas.
23 The burden of spending on diagnostic tests like medicines appears to be greater for the rural population in comparison to the urban in both the public as well as private sector.There is also substantial variation in expenditure across states (see annexures 6 and 7). In public hospitals, households spend the highest proportion of total expenditure on diagnostic tests in Tamil Nadu and lowest in Andaman and Nicobar in rural areas and highest proportion in Daman and Diu and lowest in Andaman and Nicobar Islands in urban areas. In case of private hospitals, the highest out of pocket spending as a proportion of total expenditure for treatment was in Meghalaya and lowest in Manipur in the rural areas and in urban areas the highest proportion was spent on diagnostic tests in Arunachal Pradesh and the lowest in Assam.
P
ublic sector investment in health is appallingly low leading to substantial out of pocket spending on health in general and medicines and diagnostics in particular. To reduce this burden it is important to scale up government spending. However, merely increasing public health expenditure will not bring fruitful results unless efficient procurement and supply chain management systems are put in place to ensure that medicines are available at the point of healthcare delivery. The system of centralized procurement and decentralized distribution of medicines as in Tamil Nadu has proven to be most effective in ensuring availability of medicines at the point of care as well as utilizing monopsony power to ensure competitive behaviour of the suppliers. This model should be scaled up and replicated in low performing states for improved outcomes.In the meantime, the private sector continues to play an important role and therefore requires effective regulation. Medicines worth INR 112410.80 crore were sold in the private market in the year 2016. FDCs known to be mostly irrational are used rampantly in the country. Antibiotics too, are among the top selling medicines in the country despite being banned from being sold over the counter. Price regulation covers an abysmally small proportion of the Indian pharmaceutical market. A reduction in prices has also been largely unimpressive owing to the use of a market based formula. All this points towards inadequate regulation in the private sector in the current scenario.
Although Indian patent law incorporates flexibilities provisioned under the TRIPS agreement, evidence suggests that these flexibilities have rarely been evoked. It is important to note that while having a set of good laws and legislations is important it is equally important to have mechanisms in place for their effective utilization. The regulation of pharmaceuticals is fragmented as drug licensing is the responsibility of the Central Drugs Standard Control Organization (CDSCO) under the Ministry of Health and Family Welfare, whereas the Department of Pharmaceuticals (DoP) under the Ministry of Chemicals and Fertilizers regulates medicine prices.
The issue of regulation assumes even greater urgency involving medical technology. Although over 20 medical equipments have been identified and more are being considered for inclusion in the list to be controlled, currently only the cardiac stent and implants are under price control. There is a need to identify an essential list of medical equipments which are required to be regulated for both quality and price. A consolidation of pharmaceutical regulation under the Ministry of Health and Family Welfare would lead to better coordination and at the same time it would be top priority for public health in the country.
Footnotes:
1. Government of India, National Health Accounts Technical Secretariat, National Health System Resource Centre, Ministry of Health and Family Welfare, National Heath Accounts-estimates for India 2013-14.
2. Government of India, Ministry of Statistics and Programme Implementation, 2016, National Sample Survey Office, 2014, Health in India, NSS 71st round.
3. S. Selvaraj, H.H. Farooqui and A. Karan, Quantifying the financial burden of households’ out of pocket payments on medicines in India: a repeated cross-sectional analysis of National Sample Survey data, 1994–2014 BMJ Open 2018;8:e018020. doi:10.1136/bmjopen-2017-018020
4. S. Selvaraj et al., Access to Medicines Report, Public Health Foundation of India and the Norwegian Embassy, 2015.
5. Government of India, Ministry of Health and Family Welfare (Department of Health), The Drugs and Cosmetics Act, 1940 (as amended up to 30 June 2005); web link: http://www.cdsco.nic.in/writereaddata/Drugs& CosmeticAct.pdf
6. Department of Pharmaceuticals, Indian Pharmaceutical Industry, Ministry of Chemicals and Fertilizers, Government of India; Web-link: http://pharmaceuticals.gov.in/; accessed on 17/9/15.
7. Government of India Web-link: http://www.nppaindia.nic.in/
8. Government of India Web-link: http://www.cdsco.nic.in/forms/contentpage1. aspx?lid=1424
9. Ibid.
10. S. Selvaraj, ‘Pharmaceutical Regulation in India’, in S. Selvaraj, D. Abrol and K.M. Gopakumar (eds.), Access to Medicines in India. Academic Foundation, Delhi, 2014, pp. 221-233.
11. Ibid.
12. WHO Guidelines on Country Pharmaceutical Pricing Policies, World Health Organization, 2013.
13. Department of Pharmaceuticals, National Pharmaceutical Pricing Policy, Ministry of Chemicals and Fertilizers, Government of India, 2011.
14. S. Selvaraj, M. Aisola, A. Mehta and D. Abrol, An Independent Evaluation of the National Pharmaceutical Pricing Policy, 2012 and Drugs Price Control Order, 2013, ISID-PHFI Collaborative Research Programme, 2013.
15. Ibid.
16. S. Chaudhari, C. Park and K.M. Gopakumar (edited by Kajar Bharadwaj), Five Years into the Product Patent Regime: India’s Response, United Nations Development Programme, 2010.
17. K.M. Gopakumar, ‘Patents and Access to Medicines: Constrains for the Use of Flexibilities’, in S. Selvaraj, D. Abrol and K.M. Gopakumar (eds.), 2014, op. cit., pp. 105-144.
18. Duggan and Goyal, Pharmaceutical Patents and Prices – A Preliminary Empirical Assessment Using Data from India, Policy Research Working Paper 6063, The World Bank, 2012.
19. S. Chaudhari, C. Park and K.M. Gopakumar, 2010, op. cit., fn. 16.
20. S. Selvaraj. and A. Mehta, Access to Medicines, Vaccines and Medical Devices in India, India Infrastructure Report 2013-14 – The Road to Universal Health Coverage. IDFC, Orient BlackSwan, Delhi, 2014.
21. K.M. Gopakumar, 2014, pp. 105-144, op. cit., fn. 17.
22. A. Mahal and A.K. Karan, ‘Diffusion of Medical Technology: Medical Devices in India’, Expert Reviews, 2009, pp. 197-205.
23. Government of India, Ministry of Statistics and Programme Implementation, 2016, National Sample Survey Office, 2014, Health in India, NSS 71st round.
|
Annexure 1 State-wise Government Spending on Healthcare and Medicines (INR), 2010-11 |
||
|
Names of States |
Overall Expenditure on Healthcare 2010-11 (Rs Crore) |
Drug Expenditure as % of Health-care Expenditure |
|
Assam |
86.35 |
5.0 |
|
Bihar |
133050 |
7.0 |
|
Gujarat |
154.31 |
7.6 |
|
Haryana |
60.90 |
5.5 |
|
Kerala |
248.61 |
12.5 |
|
Maharashtra |
208.82 |
5.2 |
|
Madhya Pradesh |
122.13 |
9.3 |
|
Punjab |
15.45 |
1.0 |
|
Rajasthan |
38.54 |
1.5 |
|
Uttar Pradesh |
314.81 |
5.3 |
|
Jharkhand |
27.16 |
3.4 |
|
West Bengal |
214.03 |
6.8 |
|
Andhra Pradesh |
234.58 |
10.0 |
|
Karnataka |
148.31 |
6.3 |
|
Tamil Nadu |
436.57 |
12.2 |
|
Himachal Pradesh |
11.22 |
1.9 |
|
Jammu & Kashmir |
45.50 |
4.3 |
|
Central Government |
2,533.68 |
15.0 |
|
Total |
5,034.47 |
13.0 |
|
Source : Budget estimates from documents of respective states and central government. |
||
|
Annexure 2 Average Medical Expenditure (INR) per Hospitalization Case During Last 365 Days and Percentage Spent on Medicines for Public Hospitals in Each State/UT |
||||
|
State/UT |
Public Hospitals |
|||
|
Total Rural |
% Medicines Rural |
Total Urban |
% Medicines Urban |
|
|
Andhra Pradesh |
3555 |
42.70 |
3629 |
29.54 |
|
Arunachal Pradesh |
4682 |
46.13 |
7669 |
40.77 |
|
Assam |
5080 |
32.42 |
16949 |
21.52 |
|
Bihar |
6243 |
39.60 |
12271 |
36.93 |
|
Chhattisgarh |
3969 |
47.49 |
3708 |
49.73 |
|
Delhi |
4606 |
57.21 |
10166 |
24.38 |
|
Goa |
3177 |
69.81 |
15002 |
38.34 |
|
Gujarat |
6620 |
22.13 |
7451 |
21.58 |
|
Haryana |
9648 |
44.88 |
14773 |
32.55 |
|
Himachal Pradesh |
14787 |
39.35 |
28826 |
29.95 |
|
Jammu & Kashmir |
6475 |
64.05 |
8762 |
54.19 |
|
Jharkhand |
4340 |
53.29 |
9545 |
32.67 |
|
Karnataka |
4389 |
54.07 |
4136 |
50.68 |
|
Kerala |
3035 |
30.94 |
2743 |
43.64 |
|
Madhya Pradesh |
3282 |
52.35 |
13981 |
12.48 |
|
Maharashtra |
5278 |
48.90 |
4768 |
50.36 |
|
Manipur |
5068 |
66.16 |
7281 |
57.97 |
|
Meghalaya |
1302 |
63.98 |
8309 |
36.12 |
|
Mizoram |
6261 |
68.58 |
5522 |
68.09 |
|
Nagaland |
2403 |
61.71 |
4275 |
48.54 |
|
Odisha |
5877 |
58.35 |
7285 |
53.59 |
|
Punjab |
11866 |
33.09 |
15114 |
22.00 |
|
Rajasthan |
3815 |
45.64 |
7943 |
39.24 |
|
Sikkim |
3224 |
47.05 |
2667 |
60.67 |
|
Tamil Nadu |
459 |
31.59 |
780 |
35.13 |
|
Telangana |
2987 |
65.18 |
3144 |
51.43 |
|
Tripura |
4983 |
36.93 |
4176 |
68.85 |
|
Uttar Pradesh |
8934 |
35.82 |
18288 |
17.00 |
|
Uttarakhand |
3115 |
52.13 |
6021 |
38.86 |
|
West Bengal |
7224 |
35.06 |
8157 |
30.98 |
|
A & N Islands |
2 |
50.00 |
220 |
0.00 |
|
Chandigarh |
8027 |
57.27 |
32889 |
43.13 |
|
Dadra & N. Haveli |
1168 |
21.23 |
1276 |
83.39 |
|
Daman & Diu |
53 |
100.00 |
219 |
34.70 |
|
Lakshadweep |
0 |
0.00 |
151 |
62.25 |
|
Puducherry |
450 |
89.11 |
678 |
38.20 |
|
All-India |
5512 |
41.44 |
7592 |
29.27 |
|
Source : NSSO report no. 574, Health in India. |
||||
|
Annexure 3 Average Medical Expenditure (INR) per Hospitalization Case During Last 365 Days and Percentage Spent on Medicines for Private Hospitals in Each State/UT |
||||
|
State/UT |
Private Hospitals |
|||
|
Total Rural |
% Medicines Rural |
Total Urban |
% Medicines Urban |
|
|
Andhra Pradesh |
16032 |
24.69 |
38949 |
21.08 |
|
Arunachal Pradesh |
13428 |
21.56 |
17827 |
26.02 |
|
Assam |
22541 |
18.15 |
79028 |
6.88 |
|
Bihar |
15288 |
29.60 |
33072 |
20.06 |
|
Chhattisgarh |
20143 |
22.30 |
30547 |
12.18 |
|
Delhi |
75153 |
13.38 |
54868 |
4.16 |
|
Goa |
57789 |
28.71 |
39626 |
34.28 |
|
Gujarat |
16648 |
22.98 |
24025 |
16.19 |
|
Haryana |
22672 |
32.96 |
36318 |
20.01 |
|
Himachal Pradesh |
31596 |
12.88 |
27990 |
15.13 |
|
Jammu & Kashmir |
38672 |
16.26 |
44269 |
27.48 |
|
Jharkhand |
14288 |
28.00 |
14442 |
28.13 |
|
Karnataka |
17650 |
30.75 |
26230 |
32.80 |
|
Kerala |
25411 |
23.78 |
21808 |
23.67 |
|
Madhya Pradesh |
24387 |
20.59 |
31142 |
20.79 |
|
Maharashtra |
24087 |
24.60 |
35690 |
20.95 |
|
Manipur |
13936 |
17.09 |
20960 |
8.33 |
|
Meghalaya |
8418 |
27.56 |
28172 |
22.98 |
|
Mizoram |
23979 |
38.16 |
25439 |
19.45 |
|
Nagaland |
14411 |
37.26 |
23417 |
47.54 |
|
Odisha |
29233 |
29.85 |
36940 |
25.38 |
|
Punjab |
34273 |
24.49 |
36411 |
14.25 |
|
Rajasthan |
23562 |
19.25 |
27202 |
19.49 |
|
Sikkim |
20826 |
27.35 |
18944 |
22.24 |
|
Tamil Nadu |
19554 |
25.06 |
33261 |
17.63 |
|
Telangana |
26353 |
15.16 |
25320 |
19.98 |
|
Tripura |
15546 |
24.13 |
73119 |
7.89 |
|
Uttar Pradesh |
22919 |
27.78 |
36931 |
18.49 |
|
Uttarakhand |
15399 |
30.83 |
38684 |
23.03 |
|
West Bengal |
25207 |
17.11 |
43410 |
9.51 |
|
A & N Islands |
57457 |
12.45 |
46237 |
15.79 |
|
Chandigarh |
44626 |
35.65 |
47879 |
15.07 |
|
Dadra & N. Haveli |
11330 |
22.05 |
9356 |
12.51 |
|
Daman & Diu |
13670 |
21.29 |
8349 |
28.04 |
|
Lakshadweep |
27968 |
19.77 |
26965 |
16.18 |
|
Puducherry |
11473 |
32.85 |
36088 |
22.41 |
|
All-India |
21726 |
24.68 |
32375 |
19.15 |
|
Source : NSSO report no. 574, Health in India. |
||||
|
Annexure 4 Broad Therapeutic Segments in the Indian Pharmaceutical Market, 2016 |
||
|
Supergroup |
Sales Values (%) |
Sales Volumes (%) |
|
Anti-infectives |
13.30 |
5.27 |
|
Cardiac |
11.72 |
5.20 |
|
Gastro Intestinal |
10.64 |
16.68 |
|
Anti Diabetic |
8.58 |
2.49 |
|
Pain/Analgesics |
7.96 |
7.16 |
|
Respiratory |
7.87 |
15.95 |
|
Vitamins/Minerals/Nutrients |
7.78 |
13.69 |
|
Derma |
6.81 |
7.14 |
|
Neuro/CNS |
5.99 |
2.91 |
|
Gynaec. |
4.88 |
4.67 |
|
Ophthal/Otologicals |
1.90 |
0.55 |
|
Vaccines |
1.75 |
0.03 |
|
Hormones |
1.70 |
2.94 |
|
Urology |
1.69 |
1.23 |
|
Oncology |
1.48 |
0.05 |
|
Others |
1.05 |
1.40 |
|
Hepatoprotectives |
1.00 |
2.35 |
|
Blood Related |
0.97 |
0.26 |
|
Antivirals |
0.71 |
0.03 |
|
Stomatologicals |
0.60 |
1.35 |
|
Anti malarials |
0.54 |
0.32 |
|
Anti-TB |
0.36 |
0.17 |
|
Anti-Parasitic |
0.33 |
0.59 |
|
Parenteral |
0.26 |
7.44 |
|
Sex stimulants/Rejuvenators |
0.12 |
0.11 |
|
Source : Authors computations based on data from IMS Health (now IQVIA). |
||
|
Annexure 5 Market Under Price Regulation, 2016 |
||
|
Supergroup |
Value (%) |
Volume (%) |
|
Anti Diabetic |
6.27 |
20.30 |
|
Anti malarials |
51.59 |
40.03 |
|
Anti-infectives |
37.17 |
32.85 |
|
Anti-Parasitic |
72.76 |
84.40 |
|
Anti-TB |
29.38 |
27.40 |
|
Antivirals |
48.15 |
62.40 |
|
Blood Related |
16.99 |
49.54 |
|
Cardiac |
24.26 |
25.92 |
|
Derma |
5.54 |
6.43 |
|
Gastro Intestinal |
13.59 |
15.13 |
|
Gynaec. |
8.59 |
2.87 |
|
Hepatoprotectives |
0.00 |
0.00 |
|
Hormones |
48.09 |
69.16 |
|
Neuro / CNS |
28.99 |
44.05 |
|
Oncology |
38.08 |
60.93 |
|
Ophthal / Otologicals |
4.91 |
15.99 |
|
Others |
8.22 |
2.63 |
|
Pain / Analgesics |
15.14 |
30.85 |
|
Parenteral |
36.51 |
54.96 |
|
Respiratory |
12.31 |
10.28 |
|
Sex stimulants / Rejuvenators |
0.00 |
0.00 |
|
Stomatologicals |
0.00 |
0.00 |
|
Urology |
0.01 |
0.00 |
|
Vaccines |
20.04 |
65.65 |
|
Vitamins / Minerals / Nutrients |
0.66 |
0.84 |
|
Grand Total |
17.67 |
19.07 |
|
Source: Authors computations based on data from IMS Health (now IQVIA). |
||
|
Annexure 6 Average Medical Expenditure (INR) per Hospitalization Case During Last 365 Days and Percentage Spent on Diagnostic Tests for Public Hospitals in Each State/UT |
||||
|
State/UT |
Public Hospitals |
|||
|
Total Rural |
% Medicines Rural |
Total Urban |
% Medicines Urban |
|
|
Andhra Pradesh |
3555 |
9.20 |
3629 |
16.56 |
|
Arunachal Pradesh |
4682 |
18.67 |
7669 |
17.88 |
|
Assam |
5080 |
13.76 |
16949 |
10.78 |
|
Bihar |
6243 |
10.19 |
12271 |
10.17 |
|
Chhattisgarh |
3969 |
19.07 |
3708 |
8.06 |
|
Delhi |
4606 |
23.01 |
10166 |
11.27 |
|
Goa |
3177 |
2.83 |
15002 |
3.24 |
|
Gujarat |
6620 |
7.16 |
7451 |
8.63 |
|
Haryana |
9648 |
15.18 |
14773 |
11.41 |
|
Himachal Pradesh |
14787 |
12.54 |
28826 |
9.20 |
|
Jammu & Kashmir |
6475 |
20.76 |
8762 |
21.58 |
|
Jharkhand |
4340 |
9.17 |
9545 |
6.97 |
|
Karnataka |
4389 |
15.81 |
4136 |
18.86 |
|
Kerala |
3035 |
24.48 |
2743 |
26.25 |
|
Madhya Pradesh |
3282 |
16.88 |
13981 |
3.83 |
|
Maharashtra |
5278 |
11.48 |
4768 |
15.35 |
|
Manipur |
5068 |
19.61 |
7281 |
23.50 |
|
Meghalaya |
1302 |
13.52 |
8309 |
10.52 |
|
Mizoram |
6261 |
8.26 |
5522 |
15.45 |
|
Nagaland |
2403 |
12.94 |
4275 |
21.50 |
|
Odisha |
5877 |
15.98 |
7285 |
16.83 |
|
Punjab |
11866 |
11.72 |
15114 |
8.00 |
|
Rajasthan |
3815 |
22.83 |
7943 |
13.50 |
|
Sikkim |
3224 |
18.21 |
2667 |
15.34 |
|
Tamil Nadu |
459 |
35.73 |
780 |
32.82 |
|
Telangana |
2987 |
11.15 |
3144 |
10.81 |
|
Tripura |
4983 |
12.82 |
4176 |
13.82 |
|
Uttar Pradesh |
8934 |
10.66 |
18288 |
6.97 |
|
Uttarakhand |
3115 |
13.26 |
6021 |
20.30 |
|
West Bengal |
7224 |
20.63 |
8157 |
12.57 |
|
A & N Islands |
2 |
0.00 |
220 |
2.27 |
|
Chandigarh |
8027 |
30.71 |
32889 |
17.55 |
|
Dadra & N. Haveli |
1168 |
31.25 |
1276 |
3.84 |
|
Daman & Diu |
53 |
0.00 |
219 |
64.38 |
|
Lakshadweep |
0 |
0.00 |
151 |
3.31 |
|
Puducherry |
450 |
2.89 |
678 |
7.08 |
|
All-India |
5512 |
15.55 |
7592 |
11.28 |
|
Source : NSSO report no. 574, Health in India. |
||||
|
Annexure 7 Average Medical Expenditure (INR) per Hospitalization Case During Last 365 Days and Percentage Spent on Diagnostic Tests for Private Hospitals in Each State/UT |
||||
|
State/UT |
Private Hospitals |
|||
|
Total Rural |
% Medicines Rural |
Total Urban |
% Medicines Urban |
|
|
Andhra Pradesh |
16032 |
12.13 |
38949 |
14.74 |
|
Arunachal Pradesh |
13428 |
14.72 |
17827 |
27.50 |
|
Assam |
22541 |
10.46 |
79028 |
2.91 |
|
Bihar |
15288 |
9.43 |
33072 |
6.05 |
|
Chhattisgarh |
20143 |
5.18 |
30547 |
4.86 |
|
Delhi |
75153 |
5.47 |
54868 |
4.02 |
|
Goa |
57789 |
5.03 |
39626 |
7.87 |
|
Gujarat |
16648 |
8.49 |
24025 |
5.91 |
|
Haryana |
22672 |
13.69 |
36318 |
9.65 |
|
Himachal Pradesh |
31596 |
5.99 |
27990 |
11.60 |
|
Jammu & Kashmir |
38672 |
6.68 |
44269 |
6.07 |
|
Jharkhand |
14288 |
8.98 |
14442 |
13.67 |
|
Karnataka |
17650 |
10.31 |
26230 |
8.54 |
|
Kerala |
25411 |
13.49 |
21808 |
11.78 |
|
Madhya Pradesh |
24387 |
6.99 |
31142 |
8.12 |
|
Maharashtra |
24087 |
8.11 |
35690 |
9.09 |
|
Manipur |
13936 |
4.43 |
20960 |
4.53 |
|
Meghalaya |
8418 |
23.44 |
28172 |
11.61 |
|
Mizoram |
23979 |
7.01 |
25439 |
11.60 |
|
Nagaland |
14411 |
8.11 |
23417 |
19.94 |
|
Odisha |
29233 |
10.33 |
36940 |
7.57 |
|
Punjab |
34273 |
10.37 |
36411 |
7.68 |
|
Rajasthan |
23562 |
9.13 |
27202 |
9.01 |
|
Sikkim |
20826 |
13.56 |
18944 |
12.89 |
|
Tamil Nadu |
19554 |
9.13 |
33261 |
8.81 |
|
Telangana |
26353 |
8.31 |
25320 |
13.65 |
|
Tripura |
15546 |
16.29 |
73119 |
6.11 |
|
Uttar Pradesh |
22919 |
7.82 |
36931 |
4.45 |
|
Uttarakhand |
15399 |
13.11 |
38684 |
15.84 |
|
West Bengal |
25207 |
8.53 |
43410 |
6.58 |
|
A & N Islands |
57457 |
12.64 |
46237 |
22.93 |
|
Chandigarh |
44626 |
8.25 |
47879 |
5.59 |
|
Dadra & N. Haveli |
11330 |
5.86 |
9356 |
5.43 |
|
Daman & Diu |
13670 |
4.55 |
8349 |
4.29 |
|
Lakshadweep |
27968 |
11.63 |
26965 |
21.05 |
|
Puducherry |
11473 |
13.54 |
36088 |
10.49 |
|
All-India |
21726 |
9.50 |
32375 |
8.52 |
|
Source : NSSO report no. 574, Health in India. |
||||