The untold farm rebound story
HARISH DAMODARAN
THE fact that the Indian economy ascended to a new growth trajectory from roughly towards the middle of the last decade is something almost universally recognized today. Not as well known and acknowledged, though, is the turnaround in agriculture that also happened around the same time. Part of this non-recognition – if one may call it that – has to do with the legacy of the India Shining campaign of the Bharatiya Janata Party-led National Democratic Alliance (NDA) government, launched just before the 2004 Lok Sabha polls. Its timing coincided with a period of acute rural distress and farmers’ suicides that actually peaked in 2004.
1The latter signals, contrary to the campaign’s ‘feel good’ theme, were picked up and reported extensively from the ground by P. Sainath and others from the late nineties. But they received prominence only after the NDA’s resounding electoral defeat, which was, in turn, ascribed to the main ruling party’s arrogance and failure to account for the existence of a not-so-shining other ‘Bharat’.
Since then, the public discourse has undergone a decisive shift towards a farm sector in terminal decline, crop yields stagnating, agriculture ceasing to be a remunerative profession, fertile fields getting devoured by urbanization, and the likes of Monsanto and Cargill taking over the entire farming ecosystem – from the supply of seeds, water and other inputs to the processing and marketing of the final produce.
While there is an element of truth to each of these perceptions, the overall ‘crisis’ narrative emanating from them – reinforced by the persistent food price inflation seen during recent times – has, however, tended to cloud any objective analysis of the performance of Indian agriculture over this period of relatively high growth for the economy as a whole.
The present essay attempts an alternative narrative to show that the last few years haven’t been all that dismal for the country’s farm sector. One would even venture to say it staged a turnaround of sorts from a bleak phase that extended through the late nineties and the early years of the last decade.
At the same time, the ‘recovery’ has not been without its limitations or unleashing contradictions whose impacts are already beginning to be felt. This essay’s basic purpose is to provoke and offer a nuanced explanation of what is happening in our rural countryside – one that seeks to avoid both naïve marketer optimism (‘they really have money nowadays to spend, whether on tractors and two-wheelers or prepaid mobile cards, shampoos and sanitary pads’) and the equally entrenched crisis view centred around farmers’ suicides and agribusiness multinationals.
C
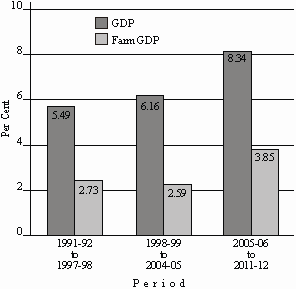
hart I compares the average annual growth in India’s gross domestic product (GDP) to that of agriculture2 over three seven-year periods: 1991-92 to 1997-98, 1998-99 to 2004-05, and 2005-06 to 2011-12.|
Chart I Average Annual Growth Rates |
|
|
It can be seen that the average GDP growth went up by just a tad between the first and second periods (from 5.5 to 6.2 per cent), and then markedly to over 8.3% during the seven years ended 2011-12.
But equally significant is the growth in farm GDP, which fell from an average 2.7%-plus during 1991-92 to 1997-98 to below 2.6% over the subsequent seven years. The last period coinciding with the so-called India Growth story, however, also saw agriculture expand by an average 3.9% a year. While not as impressive as the 4.7% growth of the 1980s – when the Green Revolution extended its spread beyond wheat in North West India to cover more crops, especially rice, across a large part of the country – it can still be termed a revival. Moreover, 3.9% is close to the 4% agriculture growth target that has been elevated to a virtual Holy Grail status in the last few five-year plans.
T
able 1 captures the recovery at an individual crop level by taking their average production for each of the three above-mentioned periods. Doing so enables evening out the effects of extreme year-to-year fluctuations induced by the vagaries of weather, thereby generating a more accurate picture of the underlying output trend.
|
TABLE 1 Average Annual Production (in million tonnes) |
|||
|
1991-92 to 1997-98 |
1998-99 to 2004-05 |
2005-06 to 2011-12 |
|
|
1. Foodgrains |
185.11 |
201.34 |
230.21 |
|
(a) Rice |
78.70 |
85.37 |
95.77 |
|
(b) Wheat |
62.33 |
70.95 |
80.85 |
|
(c) Maize |
9.66 |
12.60 |
18.36 |
|
(d) Pulses |
13.10 |
13.13 |
15.29 |
|
2. Oilseeds |
21.34 |
21.28 |
28.16 |
|
(a) Rapeseed-mustard |
5.59 |
5.50 |
7.17 |
|
(b) Soybean |
4.50 |
6.40 |
10.43 |
|
3. Sugarcane |
260.78 |
277.08 |
323.18 |
|
4. Cotton* |
14.62 |
16.81 |
30.21 |
|
5. Potato |
18.16 |
23.53 |
32.68 |
|
6. Onion |
3.86 |
5.17 |
11.98 |
|
7. Milk |
63.65 |
83.64 |
112.19 |
|
Fertilizer consumption** |
29.92 |
36.42 |
50.38 |
|
Tractor sales (lakh nos.)** |
1.75 |
2.16 |
3.72 |
|
* In million bales; ** Annual average. |
|||
The numbers are quite revealing. During the seven years ended 2011-12, the country’s foodgrain production averaged 230 million tonnes (mt), which was roughly 29 mt more than the level for the preceding period. That period, on the other hand, recorded only a 16 mt rise over the average from 1991-92 to 1997-98.
The same trend – of higher output increases in the recent period – is noticeable for oilseeds, cotton, sugarcane and milk or even staple vegetables like potato and onion. In some crops – cotton, maize and soybean – the acceleration is significant, while in pulses and oil-seeds, there has actually been a reversal of a production decline or stagnation witnessed during the previous period.
The last two rows of the table provide further evidence of a turnaround from an ‘input’ perspective. Fertilizer consumption, for example, has risen much more during the last seven years than it did in the preceding period. Tractor sales, likewise, averaged about two lakh units a year through the nineties and early part of the last decade. But between 2005-06 and 2011-12, annual sales averaged almost 3.75 lakh, while amounting to 5.35 lakh last year.
Whichever way one looks at it, the fact of an output rebound cannot be disputed, contrary to the story of agricultural stagnation that has gained currency as part of a larger ‘crisis’ discourse.
B
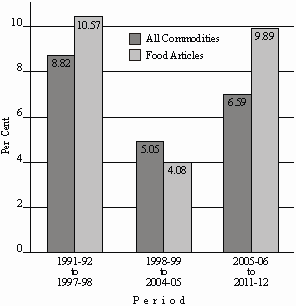
ut increased production is only one part, as it has also been accompanied by better price realizations. Since 2004-05, the minimum support price (MSP) paid by government agencies for procuring wheat has more than doubled from Rs 640 to Rs 1,285 a quintal, while going up from Rs 560 to Rs 1,080 for common paddy. This is much more than their corresponding hikes from Rs 510 to Rs 640 and Rs 415 to Rs 560 a quintal between 1997-98 and 2004-05. The higher price increases have, moreover, taken place across most crops, while even outpacing general inflation. This is brought out in Chart II, which plots the average annual wholesale price index (WPI) rise for ‘all-commodities’ against that in ‘food articles’ for the three periods that we have considered.
|
Chart II Average Annual WPI Inflation |
|
|
During 1998-99 to 2004-05, the average food price inflation of 4.1% a year was lower than the general WPI increase of just above 5%. But during the seven years from 2005-06, the trend had reversed: The wholesale inflation for food articles, at 9.9%, far exceeded the all-commodities average of 6.6%.
3 It means farmers got higher price increases for their produce than the sellers of other goods.
T
he improved terms of trade in favour of agriculture that this would suggest is also reflected in the GDP deflator used in national accounts statistics. The latter rose in overall terms by 46.5% between 2010-11 and 2004-05, the reference year. But the corresponding rise in the implicit price deflator for agriculture was greater at 81.4%, while only 34.4% for manufacturing, 36.4% for electricity, gas and water supply, 74.7% for mining and quarrying, and 42.3% for ‘others’ (which includes all services).4If the effect of higher relative produce realizations were combined with the turnaround in output alluded to earlier in the essay, it is fair to believe that farm incomes in India have risen significantly in the recent period. This becomes even more obvious when viewed against the preceding seven years, marked by both output stagnation as well as depressed crop prices. That was certainly a period of acute distress, when farm suicides touched a peak.
If farmers have come out of that bad phase, relatively speaking, what would one say about the people in rural India having no surplus produce to sell?
An answer to it can be found in Table 2 giving average farm wages in various states from 2003 to 2011, computed by the Commission for Agricultural Costs and Prices from the data of the Labour Bureau at Shimla.
5 These have doubled or even trebled in most states, compared to an 86% increase in the all-India consumer price index for agricultural labourers between December 2003 and December 2011. It, then, points to a rise in real wages.
|
TABLE 2 Average Daily Wage Rates for Male Agricultural Labourers in Rs |
|||||||||
|
2003 |
2004 |
2005 |
2006 |
2007 |
2008 |
2009 |
2010 |
2011 |
|
|
AP |
51.54 |
53.69 |
56.90 |
64.81 |
77.15 |
98.31 |
137.95 |
176.29 |
176.03 |
|
Assam |
65.55 |
61.96 |
66.43 |
70.41 |
79.43 |
81.19 |
96.40 |
114.10 |
127.04 |
|
Bihar |
54.06 |
54.64 |
57.43 |
59.58 |
63.05 |
71.42 |
86.55 |
101.85 |
112.83 |
|
Gujarat |
58.63 |
61.29 |
62.38 |
65.97 |
71.89 |
78.72 |
82.76 |
91.36 |
113.48 |
|
Haryana |
81.32 |
89.74 |
98.15 |
99.86 |
111.01 |
132.64 |
168.22 |
195.02 |
205.75 |
|
Karnataka |
53.71 |
54.22 |
56.09 |
58.18 |
65.05 |
72.90 |
87.54 |
111.76 |
135.76 |
|
Kerala |
206.92 |
183.03 |
211.51 |
221.37 |
202.66 |
220.27 |
250.79 |
319.13 |
375.84 |
|
MP |
46.32 |
47.67 |
46.64 |
49.83 |
71.26 |
61.33 |
69.79 |
84.43 |
97.88 |
|
Maharashtra |
59.48 |
58.03 |
61.56 |
66.31 |
74.04 |
82.61 |
95.10 |
119.36 |
151.86 |
|
Orissa |
52.15 |
53.58 |
57.62 |
57.49 |
57.72 |
68.05 |
86.70 |
123.96 |
137.08 |
|
Punjab |
83.61 |
85.59 |
86.38 |
94.97 |
95.83 |
130.63 |
133.49 |
176.21 |
188.57 |
|
Rajasthan |
72.01 |
73.10 |
80.66 |
75.00 |
99.01 |
109.84 |
113.65 |
145.69 |
154.33 |
|
Tamil Nadu |
80.89 |
77.43 |
82.29 |
85.53 |
99.96 |
113.28 |
137.98 |
174.08 |
205.94 |
|
UP |
57.77 |
58.64 |
61.52 |
64.10 |
70.51 |
81.14 |
94.89 |
116.53 |
122.51 |
|
West Bengal |
59.61 |
60.52 |
68.37 |
75.06 |
79.98 |
87.40 |
99.94 |
118.47 |
140.94 |
The import of this cannot be underestimated. Farm labourers, a big chunk of them being from Dalit or Adivasi background, have historically occupied the bottom-most rung of Indian society. An increase in their real wages implies greater bargaining power for a section that previously bore the brunt of inflation. In this case, they seem to have managed to wrest wage increases in excess of inflation.
One could attribute the above phenomenon (perhaps unprecedented) primarily to the accelerated growth in the wider economy and urbanization over the last decade that have helped create new employment avenues outside of agriculture. In combination with the National Rural Employment Guarantee Act and other public welfare programmes, these have led to a tightening of labour markets, with shortages becoming more structural and widespread as opposed to being sporadic and localized earlier. Agricultural workers, in the process, have discovered a hitherto non-existent ‘opportunity cost’ of transplanting paddy, harvesting sugarcane or picking cotton.
T
he resultant rise in real wages for farm labour has had impacts both within and outside of agriculture. The first one relates to pushing up production costs for farmers, forcing them to respond through greater mechanization. Till some ten years ago, farm mechanization was largely limited to tractors or combines for harvesting wheat and paddy in the main northern Green Revolution belt. Today, booming tractor sales apart, there is a serious market developing even for sugarcane harvesters, milking machines, paddy transplanters and direct seeding machines.6 Another indicator is herbicides, which have displaced insecticides as the fastest growing segment within plant protection chemicals. The way Monsanto is now pushing for introduction of cotton and maize hybrids, genetically engineered to ‘tolerate’ application of glyphosate-based herbicides, only shows the latent demand for mechanical weeding solutions in a country not traditionally used to a scarcity of farm hands.7As regards the impact beyond agriculture, it has come mainly through raising the ‘reservation wage’ in the economy – the lowest rate that workers are prepared to accept for jobs across sectors. Its effects have been more pronounced in an electoral democracy like India, where governments are led to compensate farmers for cost increases (including from labour) either by hiking crop MSPs or keeping the administered prices of urea, diesel, electricity and water unchanged.
E
ither way, not having a ‘cushion’ for absorbing price increases any longer – which is what the Dalit or Adivasi farm worker used to provide during past inflationary episodes – has completely altered the character of inflation in India. When the lowest stratum of society, too, starts developing pricing power and is able to pass on its costs to the succeeding layers, the result is inflation of a persistent kind. Such inflation, based on an unending spiral of price build-up from below, is rooted more in political economy and not amenable to conventional monetary quick fixes.8
F
rom the foregoing analysis, the recent period comes out as one that was fairly dynamic for Indian agriculture, and linked no less to the buoyancy in growth and incomes in the wider economy. The latter, by boosting overall demand for farm commodities – which is only natural at low levels of per capita income – turned the terms of trade in favour of agriculture. The price corrections induced by it9 incentivized farmers to ramp up production of most crops. Higher incomes also enabled them to absorb increases in farm labour costs, the impetus to which came again from an overall acceleration in economic activity. In all, it produced a virtuous cycle, where growth in ‘India’ stimulated growth in ‘Bharat’ as well. These effects got magnified in a political democracy, committing governments to expand welfare entitlements and not allow increases in global prices of fertilizers and fuel to be fully passed on to farmers.
B
ut a recovery of this kind has its limitations. In a slowing economy, a virtuous cycle can well turn into a vicious cycle, with falling demand and incomes translating into depressed produce realizations as well as wages. Moreover, lower growth, to the extent it affects revenue collections, compromises the ability of governments to sustain even existing support programmes. We are already, perhaps, beginning to see signs of these. If the current slowdown and deterioration in the global economic environment persists, it could well herald a renewed phase of rural distress and farmer suicides.The other disturbing aspect of the agricultural rebound from around the middle of the last decade is that it has happened without much government policy intervention. Such intervention, if at all, has been limited to raising MSPs and not tampering with input subsidies – though that has more to do with politics than policy. On the other hand, this period has been marked by a decline of institutions that were at the forefront of farm sector growth during the 1970s and 1980s – the Indian Council of Agricultural Research, the National Dairy Development Board or the state agricultural universities.
The research agenda is now increasingly being set by the private sector, especially multinationals, who seem more alive and proactive in responding to the changing dynamics of farming on the ground.
One can cite many examples to emphasize this point. Take the two crops to have registered significant output increases, made possible only by yield breakthroughs from new production technologies – Bt transgenics in cotton and single-cross hybrids for maize. While Bt cotton is synonymous with Monsanto, the latter is also the joint market leader with DuPont Pioneer in hybrid maize. The hybrid rice market is similarly largely with Bayer CropScience and DuPont Pioneer, just as Syngenta has a stranglehold over sunflower and is also a leading player in vegetable seeds along with Nunhems and Seminis. The last two happen to be subsidiaries of Bayer CropScience and Monsanto respectively. The multinationals have been equally quick to exploit new opportunities in mechanization – New Holland in sugarcane harvesters or DeLaval in milking machines – and use of herbicides in place of manual weeding (where the big names are the same Bayer CropScience, DuPont, Syngenta, and Dow AgroSciences).
T
his above inroads being made by multinationals, together with declining state capacity in farm research and development, is certainly going to have long-term consequences.10 Whether or not one likes it, Indian farmers are desperately seeking solutions to raise crop yields, bring down production costs, save on labour and reduce drudgery in agricultural operations. For the moment, it is only the multinationals that are seemingly catering to this demand. In this, they have an unlikely ally in the NGOs: By targeting the new technologies themselves, while undermining any competing public sector research in these fields, they are actually pushing our farmers closer to the multinationals.
Footnotes:
1. The total number of yearly farmer suicides at an all-India level, based on statistics from the National Crime Records Bureau in the Ministry of Home Affairs, amounted to 10,720 in 1995. It rose to 13,729 the next year and 16,015 in 1998, before touching a high of 18,241 in 2004. Since then, it has tended to fall, albeit gradually, to reach a level of 15,964 in 2010. On this, see P. Sainath, ‘In 16 Years, Farm Suicides Cross a Quarter Million’, The Hindu, 29 October 2011.
2. Agriculture includes output from livestock (milk, poultry, meat, etc.), but not forestry and logging, and fishing.
3. ‘Food articles’ exclude crops such as oilseeds, cotton, sugarcane and rubber. For these commodities alone, the annual WPI inflation from 2005-06 to 2011-12 averaged 7.2, 13.5, 8.5 and 22.3% respectively, which again surpassed their corresponding rates of 5.4, 1.6, 7.1, and 5.5% over the preceding seven years.
4. For details, see http://mospi.nic.in/Mospi_New/upload/nad_press_release_ 31jan12.pdf. The GDP deflator converts GDP at current market prices for a particular year into that at prices prevailing during an earlier year taken as the reference. The deflator essentially helps remove the effect of inflation, so as to enable measurement of only the growth in ‘real’ physical output between two years.
5. The daily wage rate is taken as the average for five operations – ploughing, sowing, weeding, transplanting, and harvesting – as on December of that particular year.
6. New Holland Fiat India has, this year, sold 130 cane harvesting machines in India, each costing Rs 95 lakh and above. Inclusive of spares, it would have generated Rs 150 crore for the multinational, which is part of the Fiat Group. The dairy unions of Amul are extending up to 50% subsidy to farmer-members for purchase of milking machines, with about 5,000 units already being distributed through this route. PepsiCo has been promoting direct paddy sowing technology in India, with its operations covering about 15,000 acres in 2012.
7. See Harish Damodaran, ‘Why Not GM?’ The Hindu Business Line, 19 October 2011.
8. I have elaborated on this point in an earlier article. See Harish Damodaran, ‘An Alternative "Theory" of Inflation’, The Hindu Business Line, 12 June 2012.
9. The price corrections were also an out-come of the worldwide agri-commodity boom that took off during this phase. In 2006-07 and 2007-08, India imported nearly 7.5 mt of wheat on government account, the landed cost of which went up from $178.75 to $495.85 a tonne between the first tender floated in February 2006 and the last in December 2007. The MSP increases were, in a sense, forced by the soaring global prices that made imports unfeasible both economically and politically.
10. An exceptional public sector breeding success story of recent times has been Pusa-1121, an improved basmati rice variety that today generates one billion dollars worth of annual exports. See Harish Damodaran, ‘The Story of Pusa-1121’, The Hindu Business Line, 23 October 2009.